Solution
Planning of Tasks
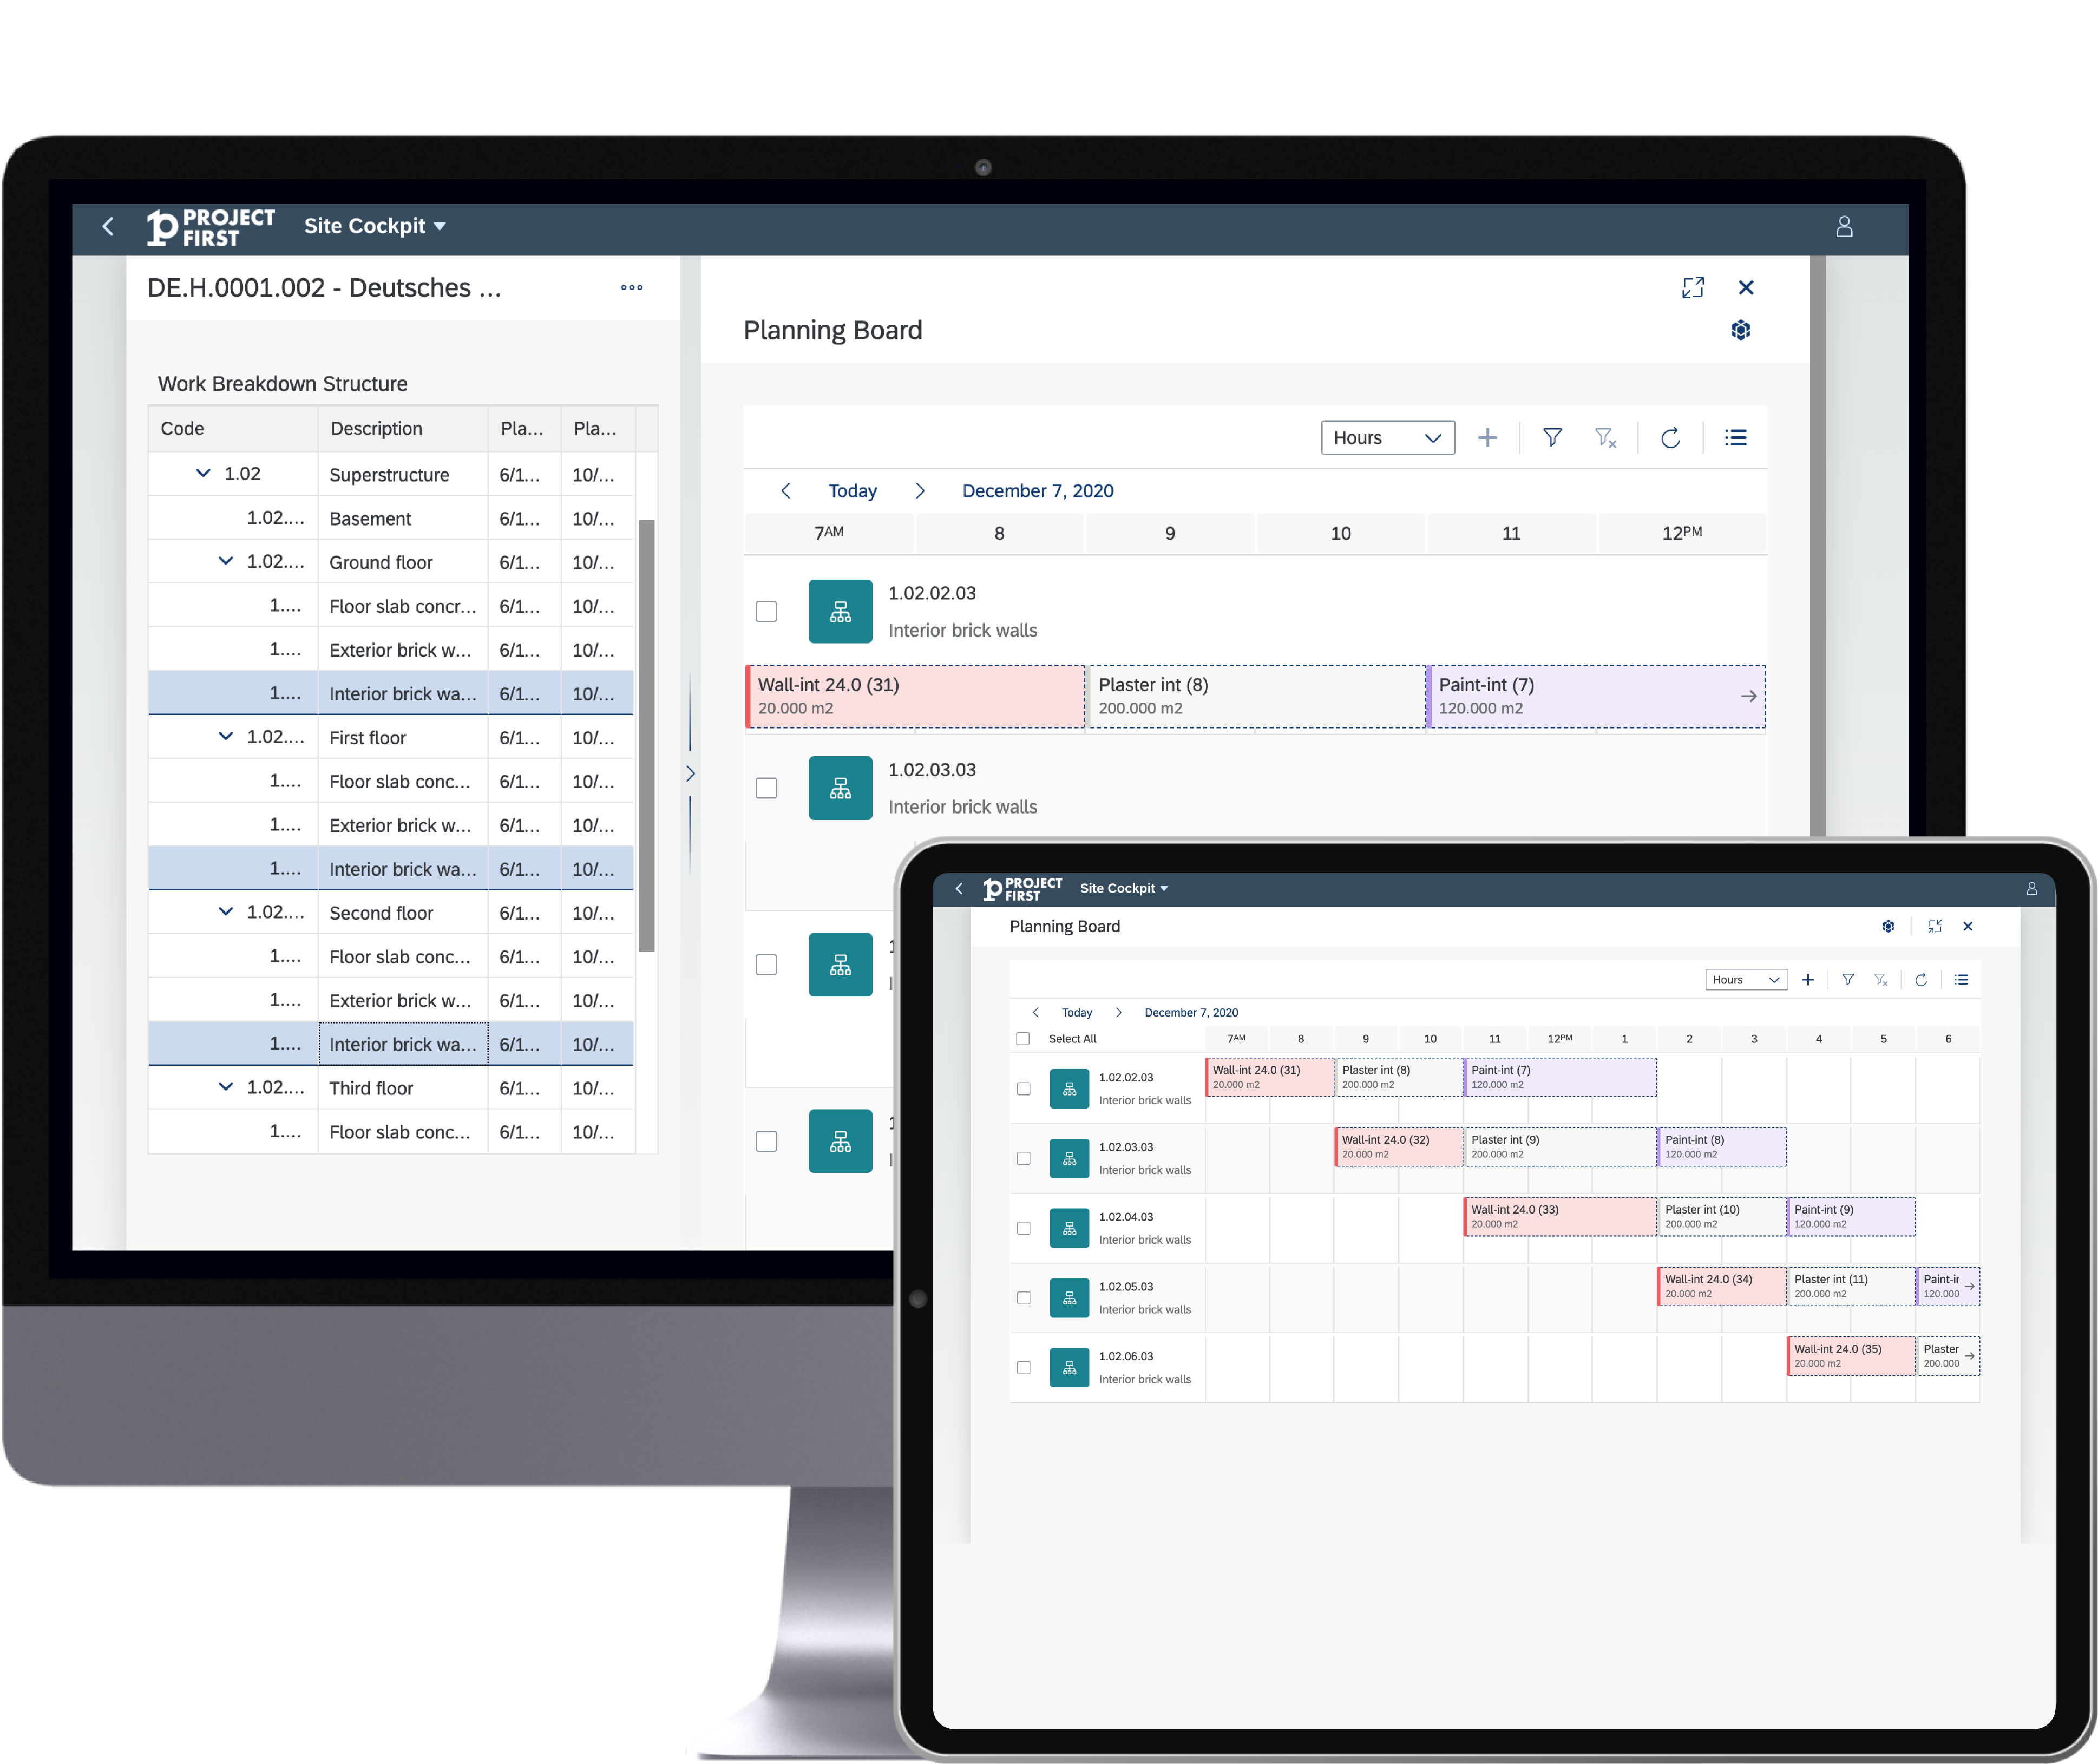
The Planning Board is the last and most precise schedule.
Placing Tasks at the intersection of time and location avoids clashes of work space.
All trades are collaborating. The Planning Board improves communication by visualizing “What, Where and When”.

Simply pick a Recipe. A new task is created at the selected location and time.
Spread Tasks with Drag & Drop or Copy & Paste easily.
Last Planner® is a registered trademark of the Lean Construction Institute.

Working hours are calculated from quantity and productivity. Calendar duration is calculated from shift definitions and weekends/holidays.
Create precise schedules with no effort.

Create a Train from Wagons (Tasks). Then generate Trains at other locations.
Divide into smaller areas to reduce the Takt and overall duration.
Execution of Tasks
Simplicity is crucial for users in the field. So we made it like Tinder.
Foremen commit to their Tasks with a swipe. Then they start, stop or complete them with a swipe.
Each Task has its own stop watch. There is no cheating with productivity. Field data is trustworthy.
The Planning Board visualizes “How” Tasks are executed.
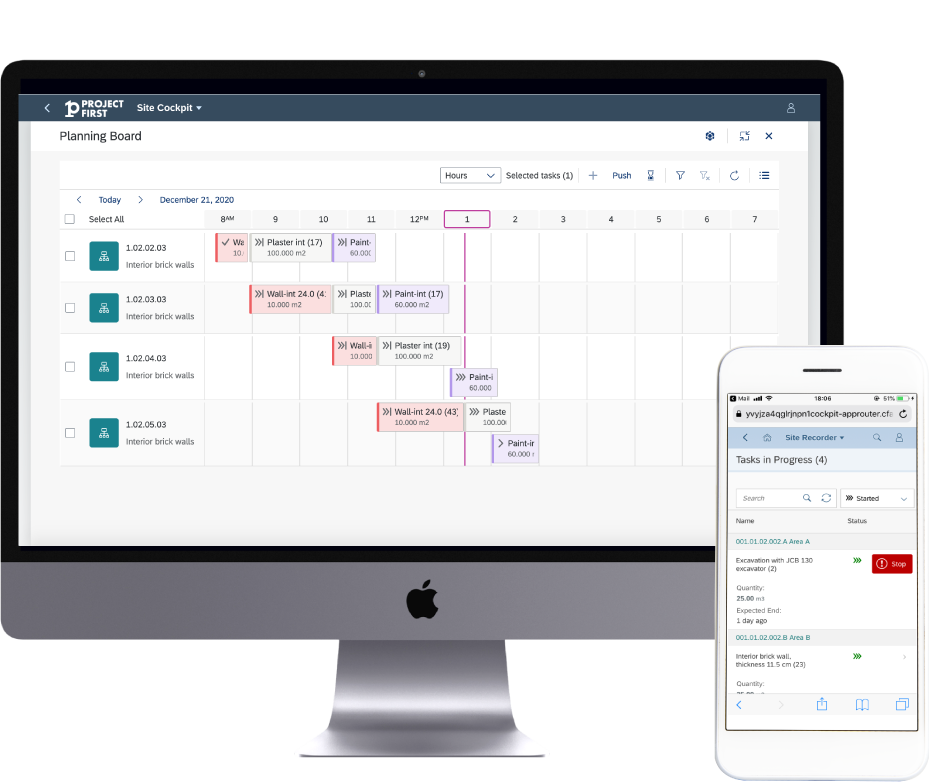

Swipe for changing the stage of a Task or for a measurement. The app then calculates current productivity and forecasts the estimated end time.
Enter Lean Cards for Problems, Ideas, Quality and Environment, Health & Safety issues and discuss them with your teams for continuous improvements.

The data collected in the field is visualized on the Planning Board in real time.
Detect late starts or stopped Tasks, check forecasted ends and potential collisions with other Tasks or missing approvals.
Act immediately and proactively deal with expected problems.
Workforce Management
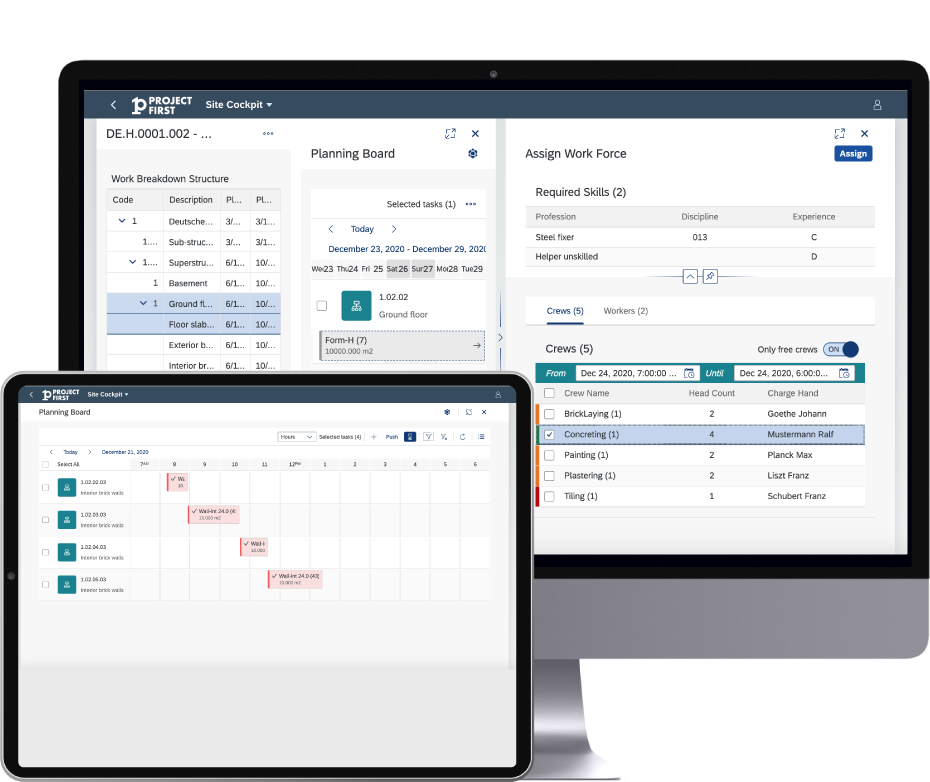
Site Cockpit knows which skills are required for each Task and suggests suitable crews that are available.
Our clash detection analyzes the ever changing plan for over allocation of workers.
The Planning Board visualizes “Who”, “What”, “Where” and “When”.

Pick the workforce for a Task from the suggested list of crews and workers.
Adjust the productivity by changing the manpower.

Assign foremen to their Tasks. They must commit before the Task can be started.
This improves motivation to deliver as promised.
Filtering crews, workers or foremen displays their work schedules.
Everyone knows what to do when and where.
Analyze Construction Data
On their way through the stages Tasks collect and generate data.
Run analytical apps to gain additional insight into your projects.
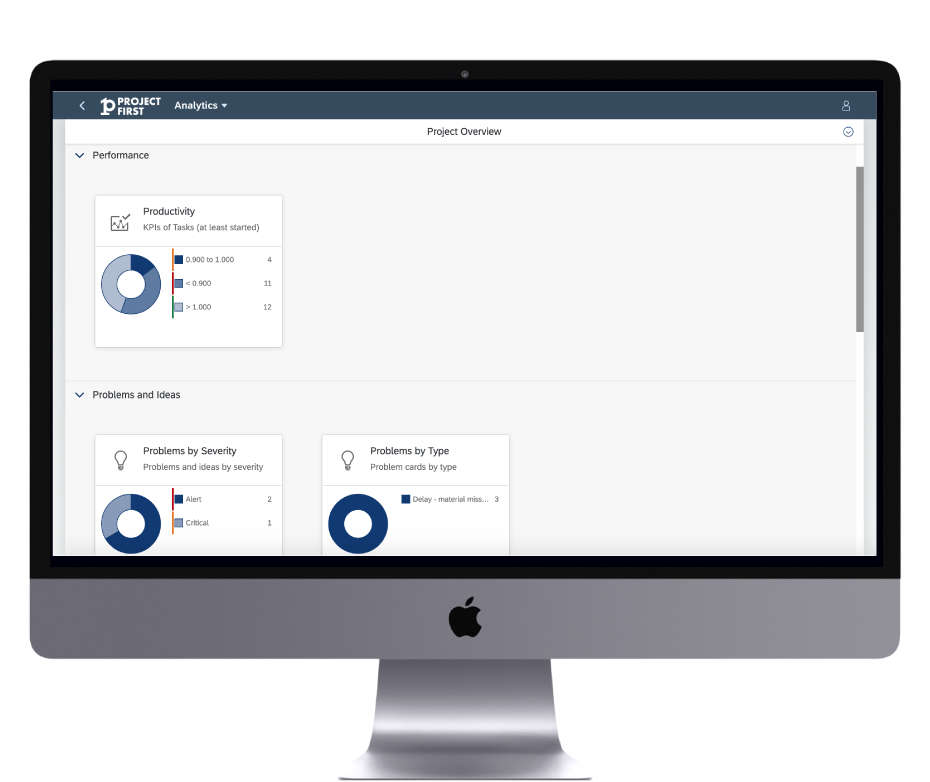

Get a quick overview of the performance of a project. Check the amount of problems, quality and EH&S issues by type and severity.

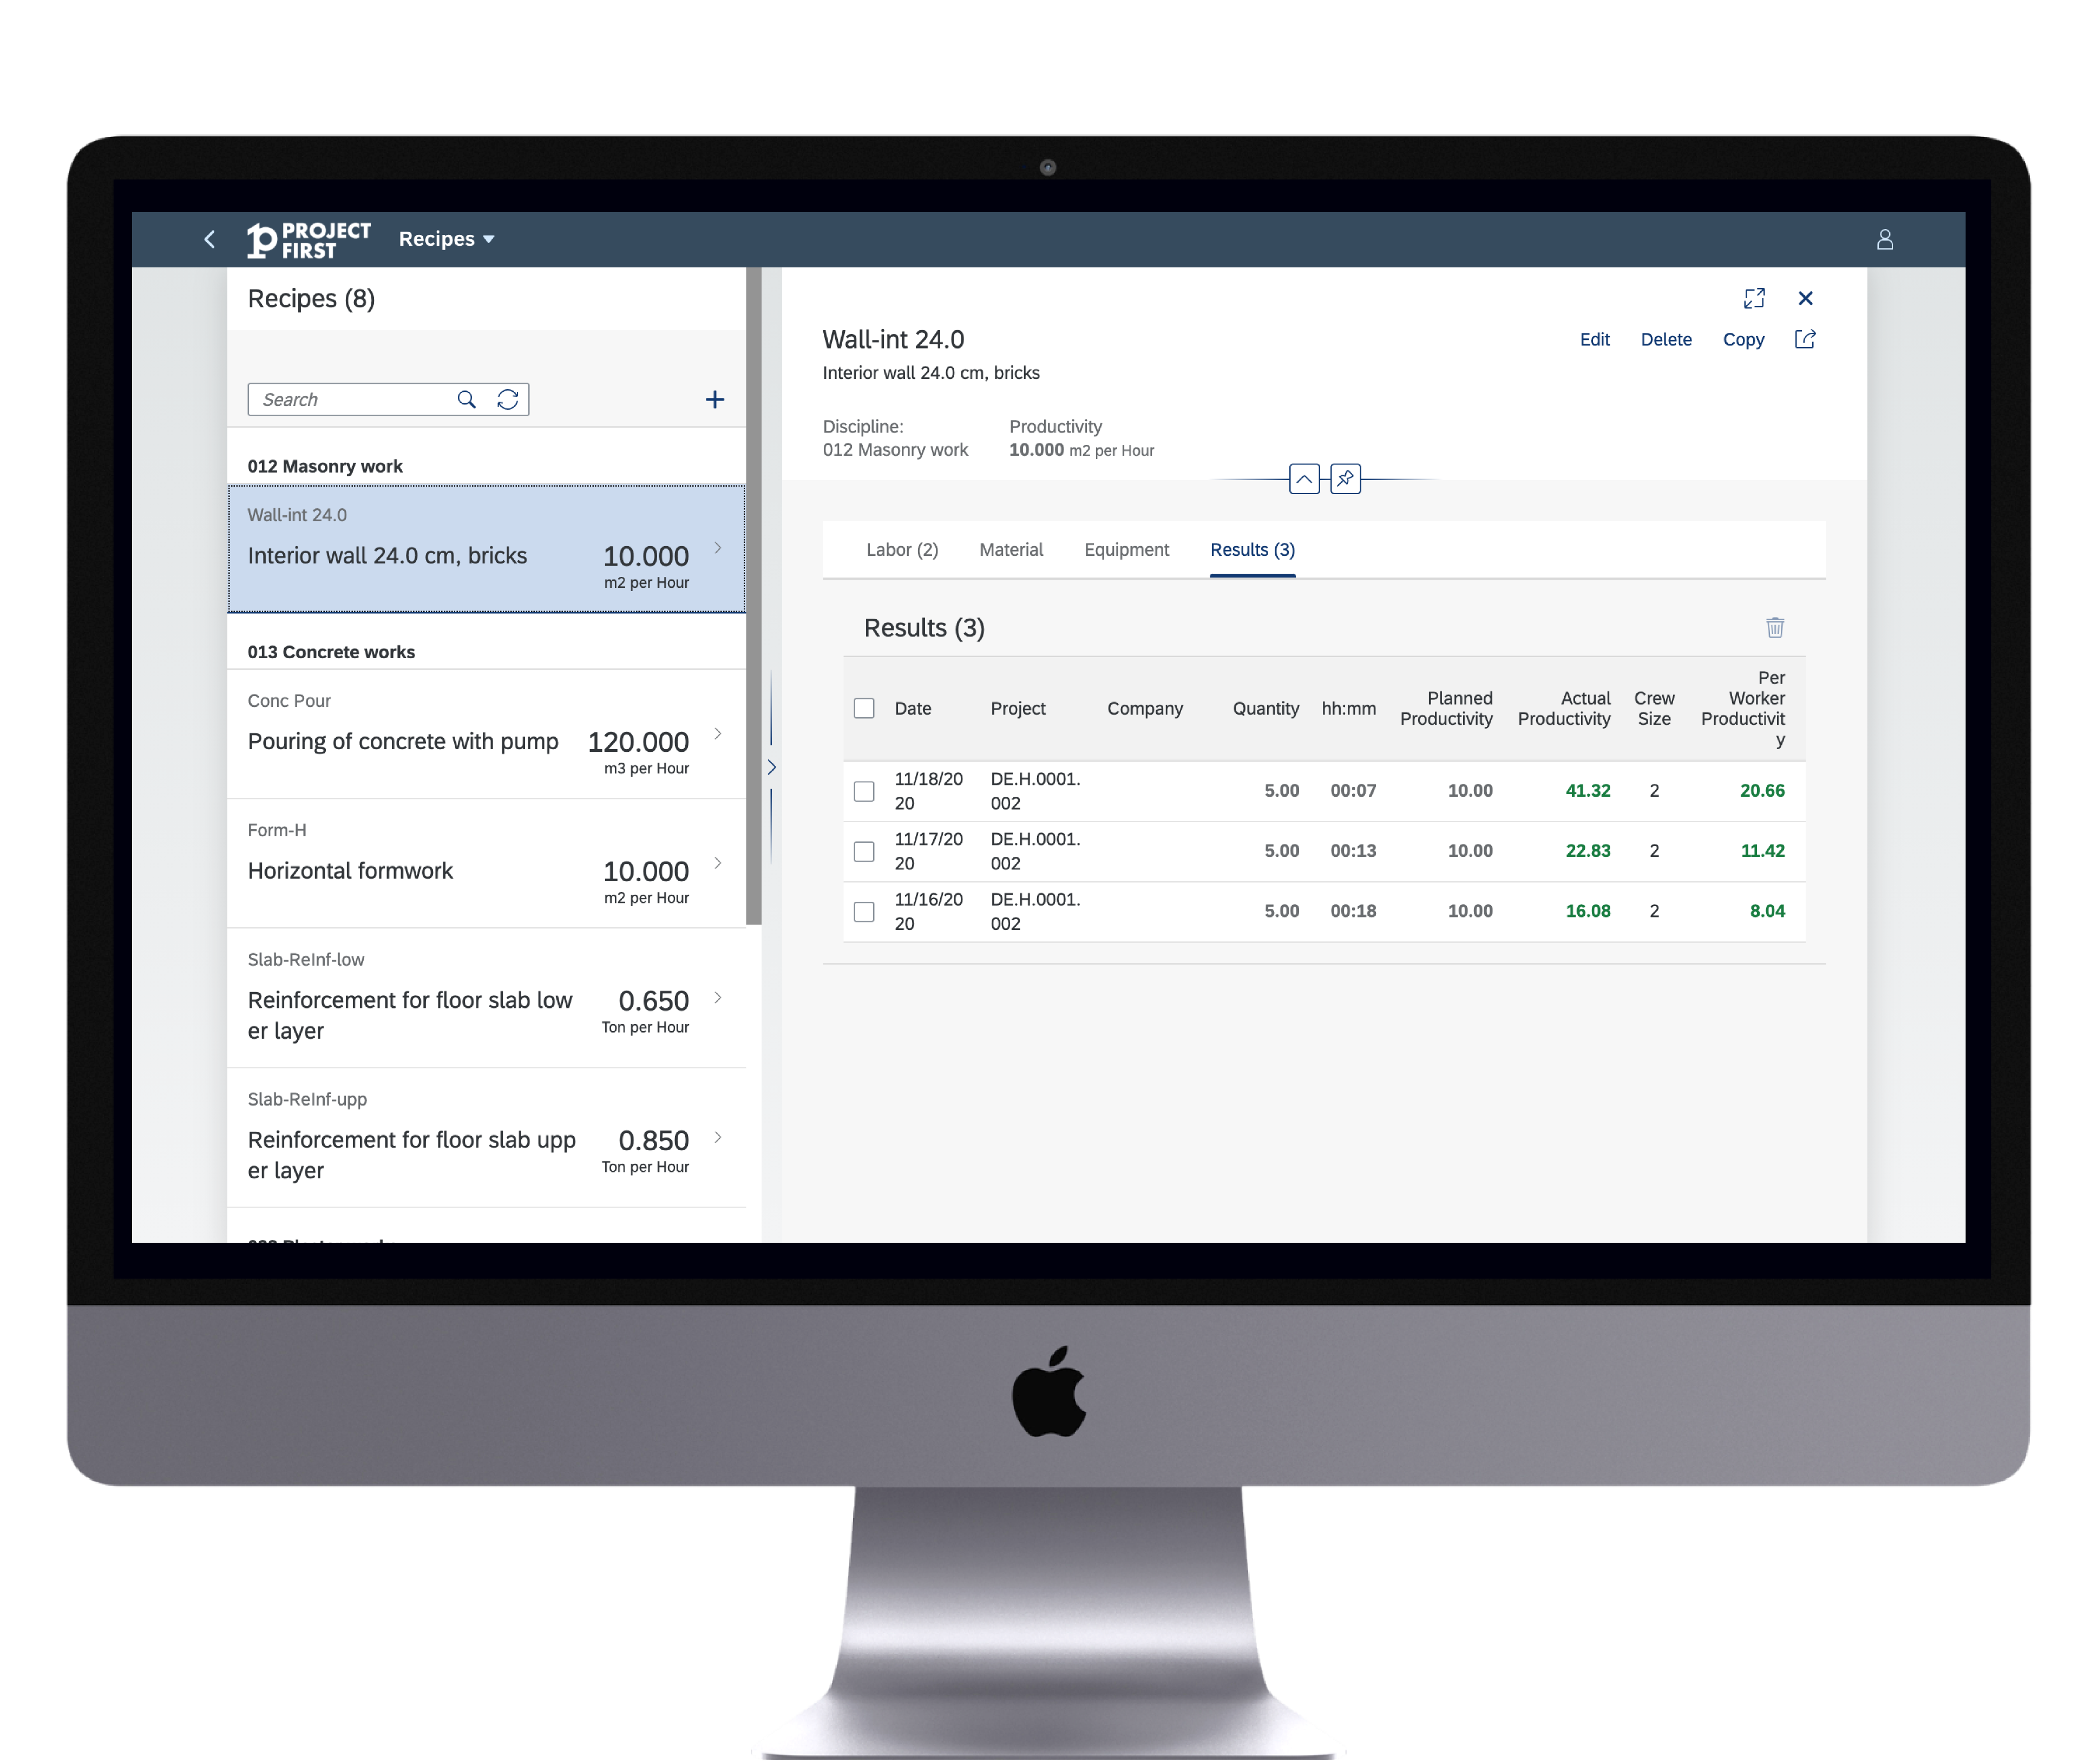
From all Tasks in all projects the productivities are stored at the recipe.
Project, contractor, quantity, duration, headcount and productivity per worker help you comparing. Reuse this set of reliable productivity information for future planning.
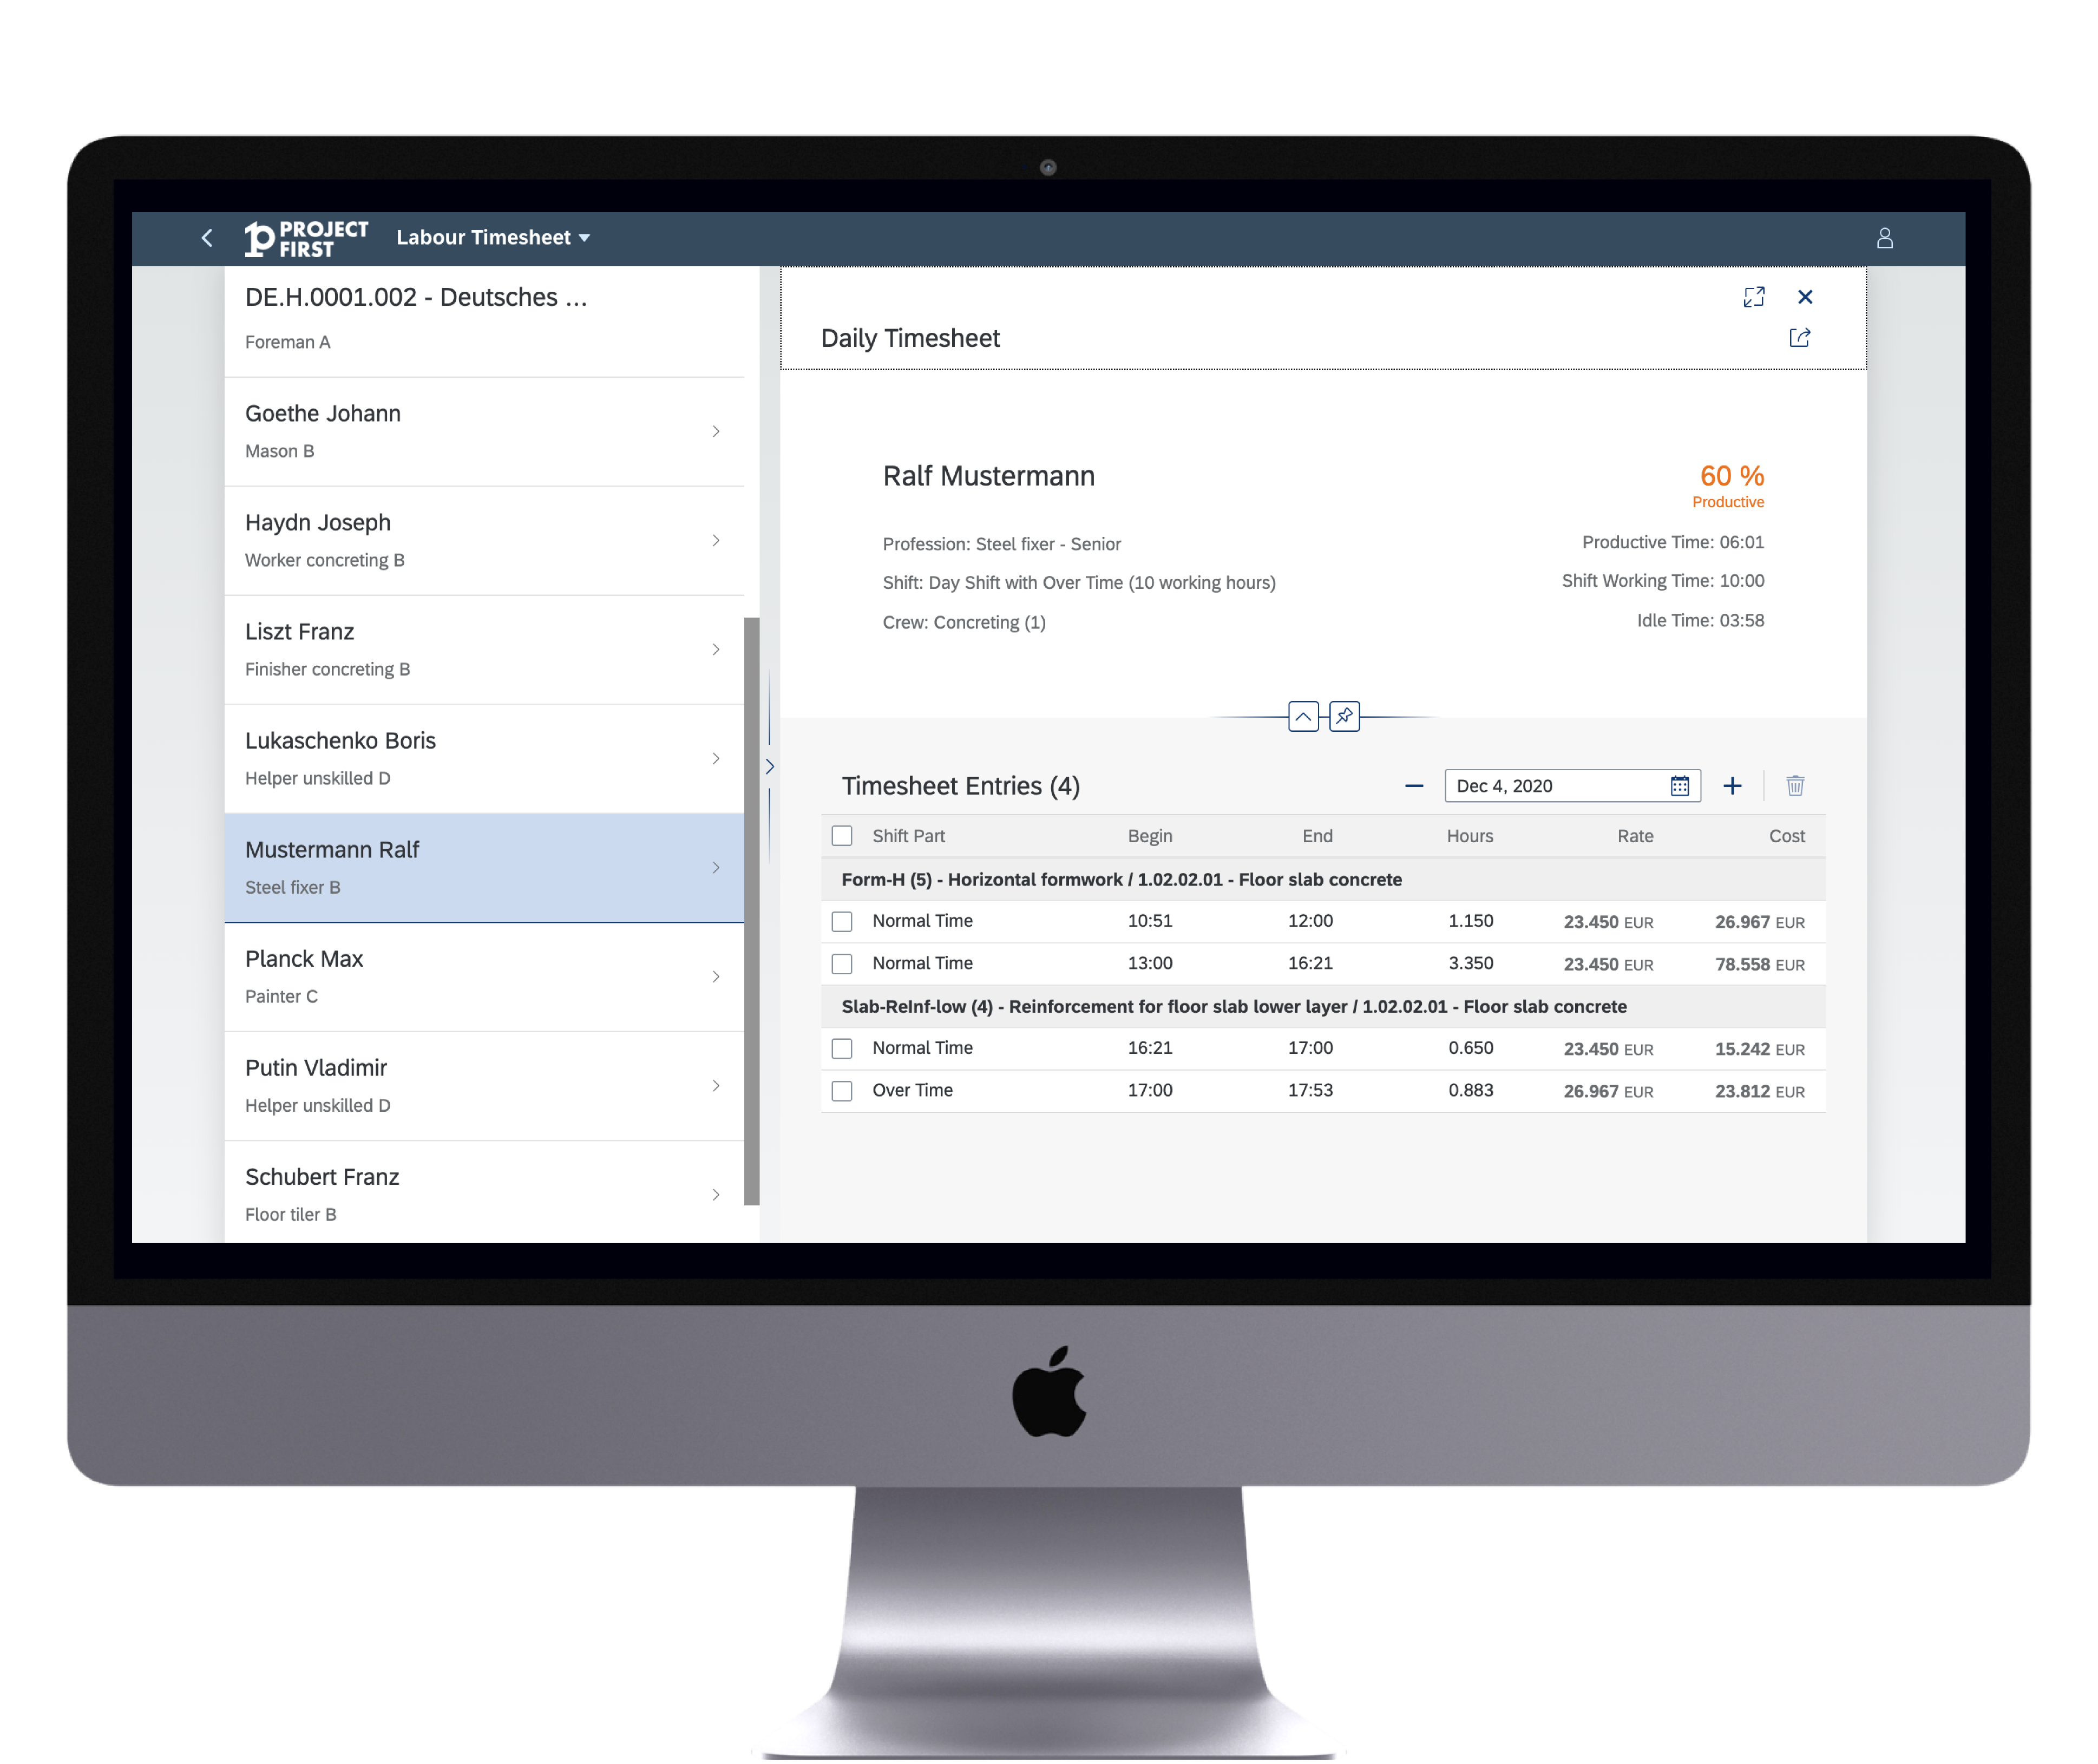

Daily worker time sheets are generated with hours spent for each Task.
Based on rates per time type the exact labor cost is calculated. The percentage of productive time is displayed as a key figure.

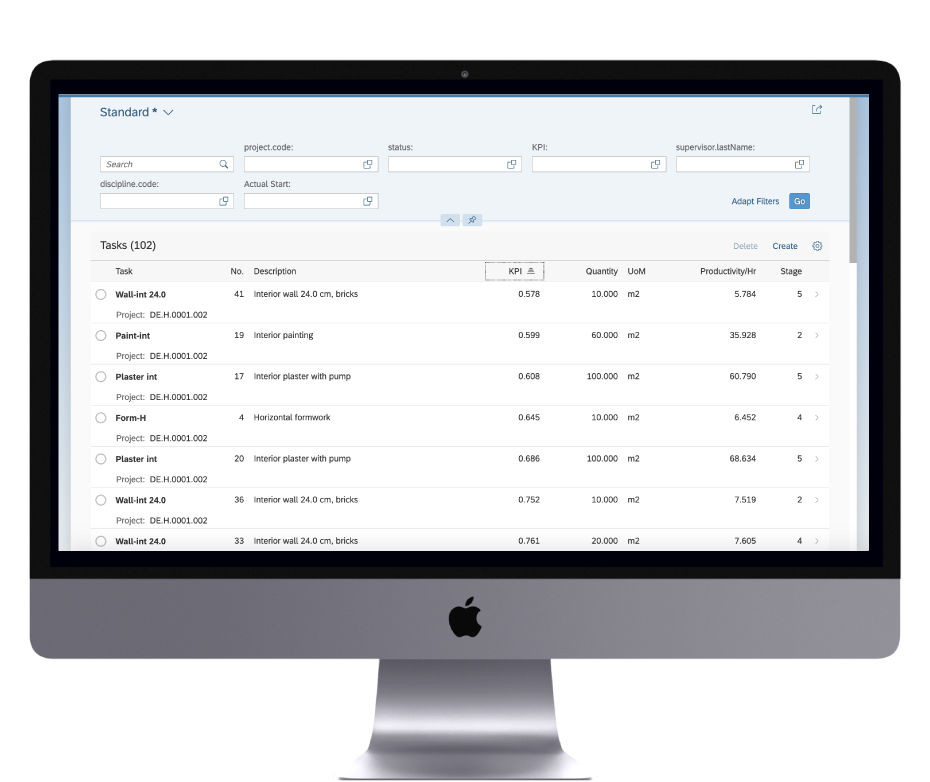
Slice & dice your big Task data. Hundreds of filters plus sorting and grouping, free column definitions and Excel® export. Crew performance, reliability of foremen, comparison of productivity in different countries...
Imagination is the limit.
Site Cockpit Apps
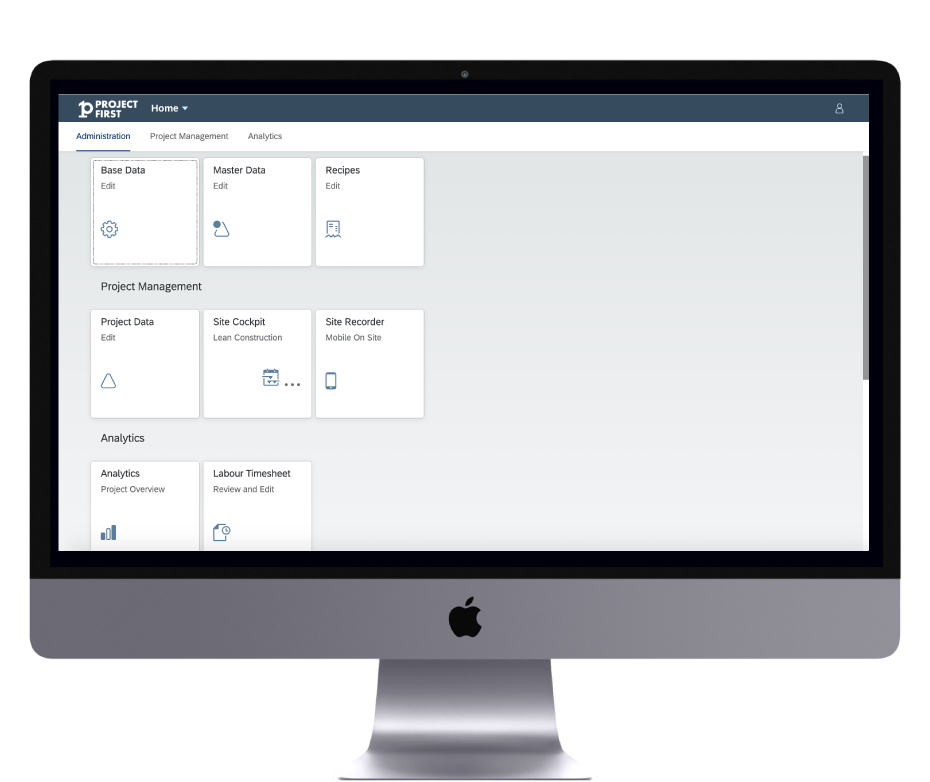

Site Cockpit Apps are developed with SAPUI5. They provide a well designed and consistent user experience and are intuitive to use.
The apps are responsive and run on desktops and mobile devices.

Identification with the SAP ID Service.
Role based Authorization.
Secure communication with the backend SAP HANA in memory database with token exchange. Deployed on the SAP Cloud Platform in the Cloud Foundry Environment.